
Improving Your MS Word Tables, Part 1
The U.S. Air Force was transitioning from propeller-driven to jet-powered aircraft and noticed an increase in accidents. One potential factor for this was the layout of the pilot’s compartment, including the seat, so the team working on the redesign took multiple measurements of over 4,000 pilots’ bodies, found the average size for each measurement, and designed a new seat to fit the average-sized pilot. Unfortunately, none of the actual pilots’ measurements were in the average range; consequently, the seat did not fit anyone.
Although not as critical as a fighter pilot’s seat, the default Microsoft settings for tables seem to aim for a kind of average look that sometimes works against the user. In the same way that the Air Force worked on a new adjustable seat once they identified the problem of designing for the average, Word provides you with many options to adjust the formatting of your tables.
Let's start with some thoughts about your tables.
Tables are all about the dataKeep anything about a table that helps the reader understand the data.
Reduce Visual ClutterRemove images and ornamentation, the obvious form of visual clutter, placed in and around tables—they do not aid in transferring data from your table to the reader’s brain. If you feel your numbers are boring, you need to get better numbers.
Another form of visual clutter is introduced by the default table setting in Word.
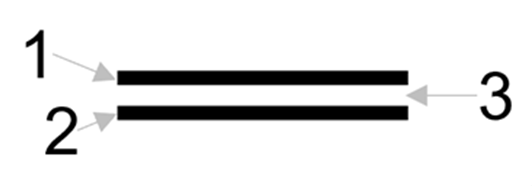
In this example, there are two lines, but their proximity creates a third element: the white space. In other words, 1 + 1 = 3. Often, this activated white space is extraneous visual activity that provides no information, just visual noise and clutter.
Remember, tables are all about the data.
The Borders of Word’s Default Table Formatting
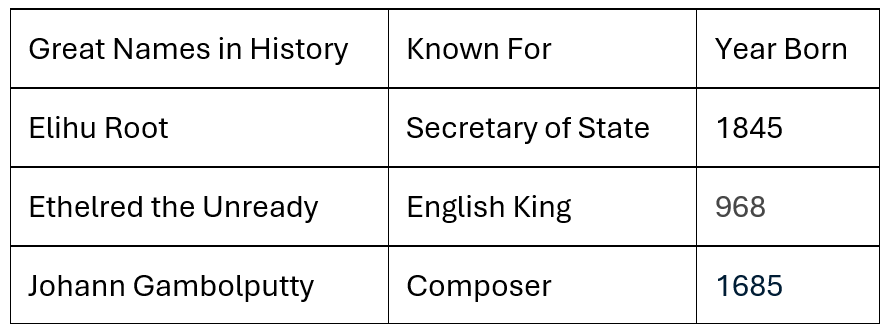
The default table formatting produces visual clutter.

The inserted data must compete with the visual clutter for the viewer’s attention. The default border settings are counterproductive to clear data display.
Here is one format change to increase visual clarity.
Format the BordersHover the cursor over the table. At the upper left corner of the table, a four way arrow in a box will appear. Right click on the box.

First, select Table Properties…

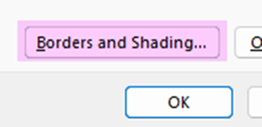
Next, on the Table tab, select Borders and Shading...
Then, under Setting, select None.

Style can remain the default.

Color: In this example, we chose the second from the top of the gray column (far left). If you’re choosing a color, select from near the top of a column—our brains see softer colors as being in the background (think shadow). Remember, the point of the table is the data, not the border!

Width: Change to the narrowest width.

Preview: Select as shown. This example will insert borders between rows and columns only.

The result removes some of the borders around the data, reducing the visual clutter, and the softer remaining borders are less noticeable than the data. To increase clarity, we decreased the headers’ font size.

Compare the result above with the original below.
Join us next time for more ideas to improve your tables!
Need Help With Your Tables?
PAI Consulting offers professional editing services to make your documents stand out.
Contact us today for a consultation and let our expert editors help you achieve clarity and impact.
Contact us for a consultationDo you have questions or concerns about editorial matters? Share them with us!
PAI Consulting | Helping you succeed. Learn more.
Any opinions expressed in this article are those of the author and not the opinion of PAI Consulting. In addition, this article may contain links to third-party websites. PAI Consulting does not endorse or make any representations about them, or any information, software, or other products or materials found there, or any results that may be obtained from using them.